I first came across Basal Body Temperature (BBT) charting when looking for a natural alternative to the current contraception methods available and I knew relying on an app to tell me the date of ovulation was unreliable – In fact, a 2018 study found the prediction accuracy of menstrual cycle apps was no more than 21%.
BBT charting is when you take your temperature first thing in the morning (every morning) to get your core body temperature and determine ovulation and hormonal shifts. This method is a hormone-free and natural alternative to some of the current contraception methods for women.
In addition to just tracking your temperature, tracking cervical mucus and other symptoms can be also assessed – this is called the symptothermal method.
The benefits of BBT charting:
To avoid pregnancy
BBT/symptothermal charting allows you to determine the exact day of the month you ovulate and when to abstain from sexual intercourse or use one-off methods for contraception, such as condoms. Cervical mucus can keep sperm alive for up to 5 days and an ovulated egg will die after 12 – 24 hours. This means there are only roughly only 6 days of your menstrual cycle you may fall pregnant – if you know your ovulation day, you can avoid pregnancy.
To fall pregnant
In the same way you use this method to avoid pregnancy if you are trying to conceive (TTC) you can plan accordingly and ensure you are having sexual intercourse on your most fertile days – this takes the guesswork out of TTC and can increase your chances of falling pregnant.
To determine hormonal imbalances
Your basal body temperature chart can help identify an underactive thyroid, patterns of anovulation and ovulation and progesterone levels throughout the luteal phase. Understanding hormonal imbalances can help get to the bottom of why you may experience PMS, spotting, or experiencing recurrent miscarriages.
You want to avoid the side effects of synthetic hormones
Synthetic hormones contained contraception methods such as the Oral Contraceptive Pill mimic your natural hormones to stop ovulation and prevent pregnancy. Given that these hormones are synthetic, women can experience unpleasant symptoms of acne, mood disorders, weight gain and even more serious conditions.
What is BBT Charting?
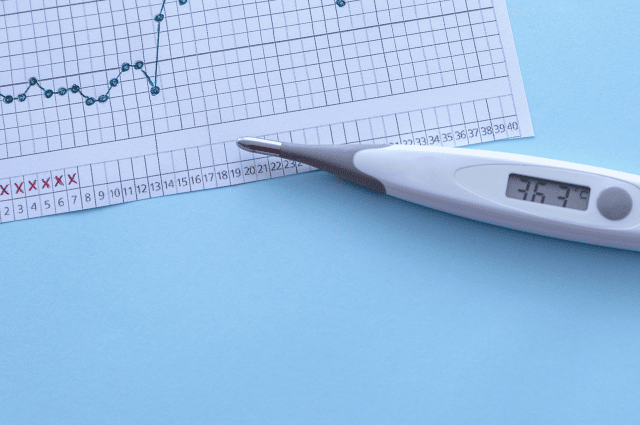
BBT charting is when you take your temperature first thing in the morning (every morning) to get your core body temperature. During a women’s menstrual cycle there should be obvious temperature changes after ovulation. When you ovulate the hormone progesterone spikes and creates a slight rise in your body temperature. When there is a rise above 0.2 degrees and if it stays higher for at least 3 – 6 days then it is a sign of ovulation.
How to chart your menstrual cycle
Before you start, you will need
- Basal body temperature thermometer – a special thermometer designed for basal body temperature or a digital oral thermometer.
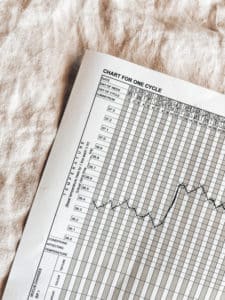
- Printed paper chart – download here
A paper chart or an app which allows you to record and track your temperature is the easiest way – I generally like to do both in the beginning! My app of choice is Kindara. I find it simple and easy to use.
STEP 1:
Decide on your baseline time (i.e this is the time you most consistently wake up – for example: if you generally wake up at 6:00 am, this is your baseline).
STEP 2:
Day 1 of your bleed is when your start charting on a new sheet (day 1). Take your temperature as soon as you open your eyes, upon awakening, but before you get out of bed, place your basal thermometer under your tongue. Be sure not to eat or drink beforehand.
STEP 3
Record temperature reading on the graph (paper or app) by drawing a dot. Continue this every morning for a full cycle. At the end of your cycle, draw a continuous line through your chart to turn it into a line graph.
STEP 4:
Record additional data to help determine hormonal imbalances and ovulation. Recording your cervical mucus changes on the chart and any other symptoms you experienced that day such as pain, bloating and fatigue.
RULES
- You need a minimum of 4 hours of sleep to establish a temperature reading
- If you wake before your baseline, you adjust your temperature up (each square = ½ hour)
- If you wake after your baseline, you adjust your temperature down (each square = ½ hour)
- If you are using an app, such as Kindara. Record the time you take your temperature each morning and make sure you adjust it accordingly as per the rules above.
How to know what day you ovulate?
Prior to ovulation, your body temperature should be lower and after ovulation, your body temperature should be higher.
On your graph, you are looking for a temperature increase of 0.4 C or higher and a sustained body temperature increase for at least 3 consecutive days (ideally until your first menstrual bleed).
A body temperature increase indicates you ovulated (it can occur 24 hours before the increase )
Basal body temperature charting initially can be hard to implement into your daily routine, but once you get into a daily rhythm it becomes second nature and after just 2 – 3 months you’ll start to see regular patterns and know the exact day you are ovulating. Understanding your menstrual cycle and getting to know the patterns and signs will help you prevent or become pregnant, depending on your goal.
I work with many women and can help teach you how to implement this daily method into your routine. I have also successfully used paper versions and apps to perform this and can teach you how to do the same!
If you are ready to understand your menstrual cycle and ditch the synthetic hormones, then call 9339 1999 or book an appointment online.